 Click chart to enlarge.
I’ve kept tabs on all of the 5+ unit sales on the Santa Barbara County South Coast since 1993. This comes in handy for listing presentations and in gauging the direction of the market. When the data is laid out visually in a graph it’s easier to understand market direction. Trust the data over advice that you should just pay over full price because someone else might buy the property.
Yes, there are pockets of perfection in Santa Barbara where the rules of gravity almost cease to exist: much of East and West Beach, parts of the Mesa, parts of the Riviera and a small group of core areas downtown. If you can afford a trophy property with nonsense numbers good for you. If you need to buy a property that is not in this etheric zone pay attention to the sales data. Also, don’t apply a broad stroke observation to every property equally. There is a world of numerical difference between a small building in a great location and a very large building in a mediocre location.
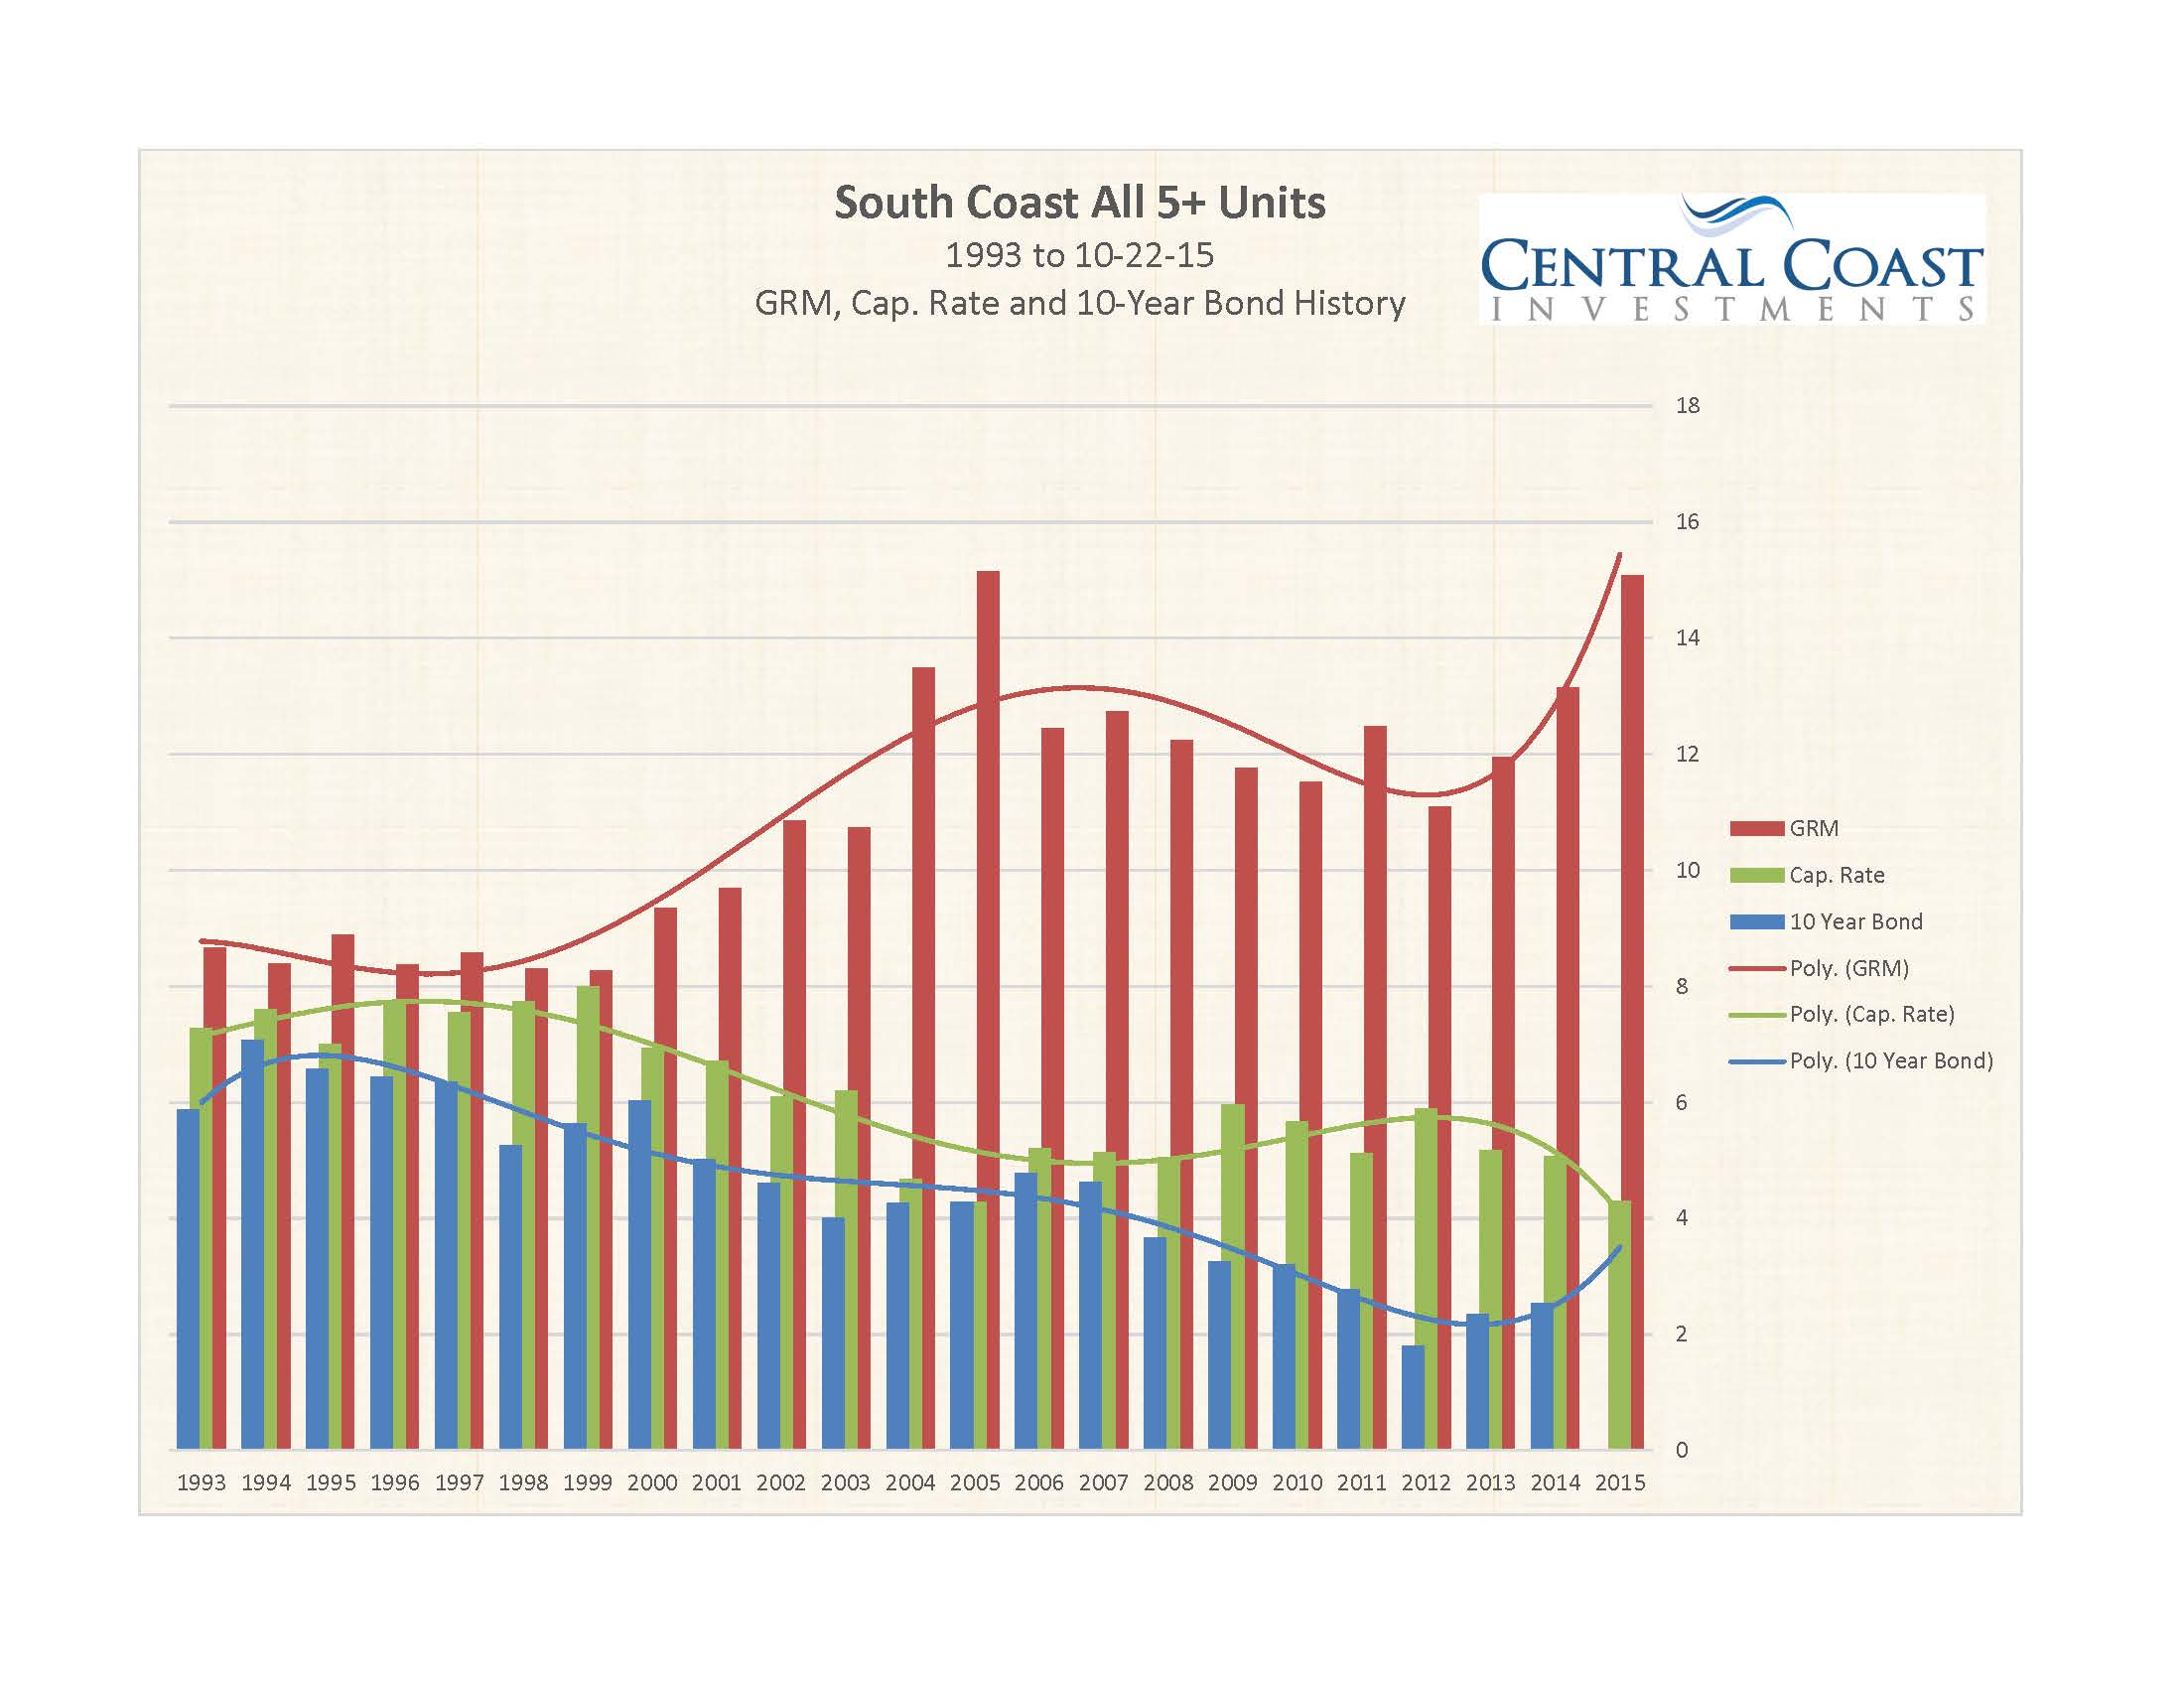
I just updated my study through Oct. 22, 2015. It’s been a banner year with lots of sales. It’s good to keep history in mind when making decisions in the present. However, opportunity exists in any market. So, what is going on in this market? The GRM / Cap. Rate[1] charts show a market turning solidly towards a sellers’ market since 2013. In fact, the trajectory during 2015 appears to have gone off the charts with excessive buyer behavior.
However, this seeming over-exuberance may be better understood in light of the dramatic rent escalation that has occurred during the past two years. According to the Dyer-Sheehan Group South Coast Apartment Market Survey report rents have increased 5.3% through Oct. 2014[2] with a similar trajectory for 2015. Maybe you can accept a 4% cap. rate if rents will increase 10% in the next 24 months.
The trendlines indicate a market that is very similar to the market in 2004-2005. This market was followed by a rather bleak period that lasted for years. However, it’s likely that continuing substantial rent increases will offset a portion of the current excesses. It seems that all sins of over-exuberance are forgiven locally if you own a property for more than 10 years.
Sets of graphs for each sub-set of multifamily properties: 5-9 units, 10-24 units, 25+ units and the entire set are available to clients.
__________________________________________________________________________
[1] GRM (gross rent multiplier): Value or price / annual gross operating income (GOI) = GRM. This is another factor in measuring or determining the value of a property.
Capitalization rate (cap. rate): The return of the property expressed as a percentage without relation to debt – net operating income (NOI) / price or value = cap. rate. This is one factor in measuring or determining the value of a property.
[2] Oct. 2014 Santa Barbara County – South Coast Apartment Market Survey, Dyer Sheehan Group, Inc.