Economic Forecast Project UCSB – May 16, 2019

I attended the 2019 South County Economic Summit produced by the UCSB Economic Forecast in May 2019. The first thing I noticed was the group seemed larger than I had expected. Why? Because there were only two speakers plus Peter Rupert as an MC, speaker and panel moderator. I had received an invitation for both the South County and North County events and noticed that there were four speakers plus Mr. Rupert at the North County event and only two speakers plus Mr. Rupert at the South County event.

I decided that I’d attend the South County event as this is the base of most of my business. Note that the UCSB Economic Forecast Project also provided attendees a 138-page study of South Santa Barbara County with lots of helpful material geared towards our local geographic area.

The North County event, which cost $50, featured speakers with a strictly regional overview except for perhaps Mr. Rupert. The South County event, which cost $200, featured a national overview with Mr. Rupert reflecting on Santa Barbara South Coast issues.

The South County speakers presented a banking perspective of the national, regional and local economies with Neel Kashkari , President, Federal Reserve Bank of Minneapolis and Kathy Moe, Regional Director, FDIC San Francisco. And of course, there was Peter Rupert, Executive Director UCSB Economic Forecast Project. Kudos to UCSB for producing this event and the sponsors and board. There is an incredible amount of preparation and coordination that goes into this premier annual economic forecast which appears so professional and seamless. I have been blessed with being able to look behind the curtains, so I know!

I’m here writing this synopsis after the event looking at the South and North County invitations and can’t help but compare the two. The South County event usually has more speakers and reflects a national and at sometimes, international overview coupled with Mr. Rupert’s observations on the local arena. Sometimes there have been speakers in more outlier professions like social media and cutting-edge projects like the Allosphere Research Facility at UCSB. I find economics interesting, but I’ve found some of these other speakers truly fascinating! Full disclosure: I was an English Literature major at UCSB so maybe that explains it!

Everyone I mention the event to who did not attend wants a short summary. That is easier this time with the more limited panel. The overriding question at this juncture is “When will the recovery end?”

Mr. Rupert’s is always entertaining as well as informative. His views of the current global economy were “Kinda Sucks” as opposed to the U.S. economy as “Doesn’t Suck” so there’s your short answer! Of course, he did provide lots of material and slides to support those statements.

Both speakers and Mr. Rupert honestly answered that they don’t know when a recession will occur. Kathy Moe gave a very reasoned presentation as to, while the recovery is likely in the latter portion of this economic segment, there are no consistent indicators of an imminent recession. She cautioned that the larger national banks remain at risk in a recession because capital and reserve requirements need to be increased. These banks remain “too big to fail” in a recession like in 2005 and might require taxpayer bailouts if this doesn’t change. However, the current administration is not supportive of increased restrictions.

Neel Kashkari made a personal (non-official) argument that a mistake was made in the string of interest rate increases that occurred in 2018. He argued that the focus on a 2% inflation rate should not be a static target and that many other considerations factor into the equation as to when the economy needs some braking.

Mr. Rupert provided a very convincing set of slides supporting his view that “…when viewed through a historical lens, our economy appears more capable of maintaining long expansions.”[1] This overview was supported by both speakers although all speakers couched their optimism with various qualifications.

So, with that overview and the fact that the rain stopped at the end of the event, I’m very pleased and happy to report a likely positive U.S. economic forecast for the next 12 months!

____________________________________________________________________________________

Brian Bailey is the broker-owner of Central Coast Investments. He is one of the leading multifamily brokers on the Central Coast covering Santa Barbara, Ventura and San Luis Obispo counties. He has had four decades of success and has been a member of the Santa Barbara Rental Property Association since 1983.

____________________________________________________________________________________[1] Economic Summit, South Santa Barbara County, page 2


Apartment Building Income and Expense Statements – Working Magic with Marketing!

Let’s have some fun and talk about apartment building APODs! You know, Annual Property Operating Data statements. I know, you’re wondering how will that be fun? Just wait! You’ll learn how listing agents use these figures all the time to create wonderful-looking GRMS[1] and cap. rates[2]. By magic and slight-of-hand, apartment expenses become 25% of gross operating income! Reserves and management fees disappear. Actual rent is replaced by proforma rent. Is proforma even a real word?

Now why would someone do this? Do you remember your senior prom? You spent hours picking out what you would wear – yes, men too. If you didn’t own something quite right you’d go out and buy or rent it! A clip-on was OK, or so I was told. You wanted to look your best because this was a special event, right?

A sale is a special event. You only get one chance to make a great first impression. OK, no more banal clichés. So, as the listing agent, you want to have the flyer, video, spreadsheet, background data and demographic overview present the property in the best possible light. On the numbers side you want the GRM as low as possible and the cap. rate as high as possible. And you need to do this without losing all credibility – quite the balancing act! This is where the magic comes in!

To get a true picture of the financial status of the apartment building under consideration, smart buyers and selling agents will look past the listing agent’s glamorous presentation and drill down to the true picture of income and expenses. To do this, you need to have brokered hundreds of sales and reviewed hundreds of these statements like I have or read this handy-dandy cheat sheet!

Working magic with income figures

Now, there aren’t many things you can do with the current rents. They are what they are right? Well, even light waves can bend. I’ve seen the APOD only reflect proforma rents with notations that the units are “currently rented to family members” or “month to month tenancies” or other dismissive language that says, “Don’t look here; move on!” I’ve seen current rents mentioned, but the analysis only comprehends proforma rents. OK; I’ve done this.

What about proforma rents? Has the listing agent included a rent survey? Probably not. Usually, the proforma rents just appear in a column without any backup data. Doing a rent survey is drudge work and, like my fellow brokers, I hate doing it. However, it is the most accurate way to estimate proforma rents if the survey is unbiased. Good luck getting an unbiased rent survey in a listing agent’s package. Do you want a true picture of proforma rents? Just do the drudge work yourself or have your broker do it.

A local alternative would be to use the summary chart for the subject’s sub-area in the Dyer Sheehan Apartment Market Survey[3]. Sometimes I’ll use this but doing an actual rent survey yourself is best.

What about vacancy factor / credit losses? In the real world these always exist. There is always down time between tenancies and collection issues are common. Does this line item reflect the real-world market? Think about it – if your average turnover is say 10 days of turnover work every two years you have an inherent 1.4% vacancy factor even if you rented the apartment on day one. If it took you say seven days to rent the unit on top of the turnover period, you have a 2.3% vacancy factor.

If the GOI[4] in the seller’s books does not reflect the listing agent’s APOD figures, ask why. Is the vacancy factor / collection loss factor higher? Were there some evictions? Is there excessive turnover or downtime? Why?

Working magic with expense figures

Now let’s get to the real problem area in apartment building APODs – expense line items. Here’s where creativity, inexperience, stupidity and little white lies go head to head!

I’ll go in the order of the CCIM APOD[5]. Sorry, another acronym – CCIM – Certified Commercial Investment Member. This is a very prestigious, hard to obtain commercial real estate designation. A CCIM designation involves a serious investment of time and money and, in my opinion, is the highest and most respected professional designation a commercial real estate broker can obtain. If your real estate agent is a CCIM you’re typically in very good hands! My hands are good too though and I have other acronyms after my name and four decades of experience.

Other Income

This would be income from laundry machines, vending machines, parking, etc. Sometimes a broker will “estimate” this as the books may be mysteriously unavailable when the APOD preparation deadline is imminent or the income is “off-books” as in unreported cash income.

Real Estate Taxes

This is another one of my favorites! Listing agents will commonly project 1% of the list price here. That’s it right? Well, look at the current actual tax bill – available online in Santa Barbara county. You’ll find a smorgasbord of additional fees and charges: vector management, flood control, improvement district fees, sewer fees, school bonds, park bonds, library bonds, James Bonds etc. Ever-inventive government loves to tack on additional items to the real estate tax bill to fund an expansive and rather impressive array of dozens of things that never seem to go away. Do you wonder why a sewer charge that is based on water volume is on your tax bill or why there is a new school bond every few years? Sorry; there are no good answers here; just be aware of the additional charges.

I break out the real estate taxes into two lines: the basic 1% charge based on the list price or analysis price and then everything else from the latest tax bill. Now some of these things will change, but I don’t want to research each agency and their formulas. I have a life you know!

Property Insurance

Many people underinsure their properties intentionally or not. Insurance brokers will often quote building and contractor prices from statistical resources that lump Los Angeles and Santa Barbara together. You’ll know from our gas prices and experiences with many local contractors that we are considered a “cornered market”. That means, due to lack of competition, you pay more. Sorry, not sorry. So, an expected bid of $150 PSF for construction costs jumps over the moon here, even for your modest Isla Vista mansion.

The solution: Get a new insurance quote with real Santa Barbara area building costs or that offers guaranteed replacement. As a buyer, this is what you will be paying unless your insurance broker continues to underestimate local construction costs. Do I do this? Not usually. I tend to use whatever the seller provides unless it seems absurdly high or low. What me worry?

Off site and on-site management

If the seller is paying 6% for off-site management, why is the listing broker using 4%? It makes the bottom line look better that’s why! If you own 200 units your fee will be less. If this smaller building is your only managed property you’re gonna pay retail!

My favorite egregious line-item fudge is to have the listing broker not include any off-site management and include payments to an on-site “manager” as a slight rent discount. This is common, but silly since, in most cases, it would be a violation of law. There are specific formulas to recompense a resident manager spelled out in California real estate law including apartment discounts. Learn what they are and use them.

Payroll

What? Yes; in larger complexes you may have several employees involved in site operations and they get paid! I’m talking about people who only work for you regularly. And yes, your resident manager and other employees need workers’ comp. insurance, withholding and all the other items required for any employee. Don’t think any of your worker bees are “independent contractors”. If they only regularly work for the complex they are employees and subject to all the wonderful benefits and red tape of employee management. This would include the next two lines items – Expenses/Benefits and Taxes/Workers’ Compensation. (Yes, the apostrophe is in the right place). Sometimes, these employees and related expenses disappear on an APOD. Maybe they’re on vacation?

Repairs and Maintenance    

This is a prime line-item ripe for abuse. The listing agent should just use actual maintenance expenses, right? I do this on occasion, but it can be very misleading. Does the total represent a 12-month extrapolation of the past three months, past 12 months, the past calendar year, an average of the past three to five years or what? Being “selective” in the base period used may produce vastly different figures. Maybe there’s an ongoing slab leak issue that occurred in March. Ouch! Well, if we start the 12-month period in April, problem solved!

I’ve seen this line item expressed as a percentage of GOI. I’ve also seen it as a price per unit allocation. I use the latter method. I don’t want to audit the maintenance expenditures to break out capitalized items. I could get carpel tunnel! I consult with Apartment Building Appraisers & Analysts, Inc. annual workbook for Southern California[6] to get a realistic estimate. This is a wonderful resource for obtaining apartment building expense guidelines.

Utilities

These are “hard costs” and are hard for your listing agent to fudge. See how I did that! However, it can be done! I’ve seen electricity and gas expenses set at zero when I know there are separate house meters for these utilities for outside lights, laundry machines and “clean and show” costs.

Refuse is another shaky one. Is this line item just for refuse only or does it include the often-substantial charges for extra pickups and hauling related to gardening and landscaping? Sometimes the listing agent will drop any charges beyond the basic refuse pickup and forget to put the extras elsewhere even though the books reflect these charges.

A pet peeve of mine (and I have many) is when the listing agent simply lumps all utility expenses into one “utilities” line item. How can you double-check each separate utility expense item? Request separate itemizations. You get extra points for double-checking with each utility provider.

Remember to check for a sewer expense since this may be included on the tax bill rather than as a separate utility billing. When this charge is on the tax bill the listing agent may have “forgotten” to include it and just put 1% as the new tax figure. Voilà; no more sewer charge !

Watch out for a dropped month in a 12-month analysis. The last charge may have been paid late. This becomes even more significant if the charge is paid every other month.

Also, watch out if the overall percentage of total utilities / GOI exceeds around 6%. This may indicate overcrowding, master-metering or a water leak.

Accounting and Legal

This line item is often omitted and I see why. The owners total accounting bill includes work for the subject property, but the bill is not separated out for the property. I usually assign some nominal number to this work as an estimate. Look for legal expenses in the books as lots of entries may indicate systemic, negative tenancy issues like sloppy tenant screening.

Licenses / Permits

The City of Santa Barbara has an annual business license requirement for every apartment building based on income and yet this charge is seldom reflected in the listing agent’s expense statement. It could be a nefarious omission or just ignorance. Frankly, I vote for the latter. It will usually be reflected on the owner’s books as their interests are in maximizing expenses whereas the listing agent’s interests are in minimizing expenses. View the application that includes how to calculate the amount in the city of Santa Barbara here – https://goo.gl/dpKjex

Advertising

The management company may bill this out separately or it may be buried in singage installation, promotion or somewhere else. If I don’t see it, I put in a nominal expense.

Supplies

Most management companies will break out this separate line item from maintenance. I drop it and incorporate it into the price-per-unit maintenance estimate that I use.

Contract Services

This would be for say landscaping, gardening, cable TV, Dish TV, internet, pest control, fire extinguisher maintenance, furnishings in furnished units and anything that is an ongoing, contracted expense.

I usually see gardening grouped with landscaping. Some landscaping should be reflected in reserves because it may be a capital expense. Be sure that these line items reflect any extra hauling expenses or that these additional costs are reflected in the refuse line item or elsewhere.

Reserves

This would be reserves for capital expense items, i.e. roofing, asphalt replacement, appliance replacement and basically any item that your accountant would tell you needs to be capitalized rather than expensed.

Now for some esoterica! Where should the reserves line item go? Sometimes it appears in expenses. Sometimes it appears below the expense total as a separate itemization. Rather often it is entirely missing! The CCIM form places it below expenses and NOI. Appraisers have waffled back and forth on where to place this line item with the current norm appearing to be to include it in expenses.

To obtain an accurate cost estimate for reserves, an appraiser must itemize each possible capital item, estimate the lifespan of each item, estimate the remaining useful life of each item and then provide for an annual sum that should be set aside for its eventual replacement. Of course, this will vary property to property. There are tables and guidelines for this, but wow that is a lot of work! Some appraisers will do this. I’ve never seen an agent do this though. I don’t do it. Sometimes it’s estimated as a price per unit (my choice).

Why is the placement of the reserves line-item important? It is usually a large number, often near to or exceeding the maintenance figure. So, if it is not included in expenses, the cap. rate estimation (NOI/Price or Value) will be higher. Learn what the norm is in your area so that you are comparing apples to apples. Remember, an apple a day…oh! I said I wouldn’t do that cliché thing again. If the norm is for reserves to be included in expenses and the listing agent has put it below the NOI line, the cap. rate looks better, but it is misleading when trying to determine if the deal is good compared to other opportunities or past sales.

Wrap-up

The real-world overall expense ratio on a typical, separately-metered local apartment building is going to be around a third to 40% of GOI. Sorry, but that’s reality. If you see any substantial variation from this general rule look out! Something is askew or entirely unique.

Master-metered and high-abuse properties feature higher expense percentages. A brand-new or entirely remodeled building will feature lower expenses.

So, there you have it! I hope that you are now more aware of how these line items can be, shall we say, “nudged”. Remember, the APOD in the marketing flyer represents the property in its best possible light. What you want are just the true facts.

____________________________________________________________________________________

[1] GRM (Gross Rent Multiplier) – Sales price or value / annual scheduled GOI (Gross Operating Income) – The lower the better

[2] Cap. rate (capitalization rate) – NOI (Net Operating Income) / sales price or value – the yield of the property without respect to debt – The higher the better

[3] Santa Barbara County – South Coast Apartment Market Survey, Dyer Sheehan Group, Inc. (805) 653-8100, www.dyersheehan.com

[4] GOI Gross Operating Income – Gross income after vacancy and credit losses plus other income

[5] CCIM APOD forms  https://goo.gl/n5xcW8

[6] Apartment Building Appraisers & Analysts, Inc. Joseph G. Queen 562-434-0571 jgqueen@aol.com

____________________________________________________________________________________

Brian Bailey is the broker-owner of Central Coast Investments. He is one of the leading multifamily brokers on the Central Coast covering Santa Barbara, Ventura and San Luis Obispo counties. He has a four-decade history of success and has been a member of the SBRPA since 1983.


What’s Coming up in 2017? SABER Meeting Review

SABER Logo


Review:  SABER Meeting, Nov. 10, 2016
Changes Ahead in 2017: “Renewed Economic Vigor or Collapsing Into Recession…?”

__________________________________

I attended the Santa Barbara Executive Roundtable (SABER) on Nov. 10, 2016. This group generally holds monthly meetings at the University Club in Santa Barbara. Topics are timely and feature great speakers. The meetings are open to members and the public. The public cost is $35 per meeting if paid in advance.

future-crystal-ball

I don’t attend every meeting as some of the topics are not of interest. I was excited about this meeting as it was just post-election and featured a great speaker lineup:


  • Mark Schneipp, PhD – California Economic Forecast
  • Brian Johnson, General Manager – Radius Group
  • Keith Berry – Keith Berry Real Estate (Coldwell Banker)
  • Justin Anderson, President – AmeriFlex Financial Services

Locals will recognize these men. Mark Schneipp was the go-to economist for the Statistical Review Committee for the Santa Barbara Board of Realtors for years and was on staff at UCSB and featured at their economic forecast events. He is independent now and always insightful.

Mark Schneipp was featured last as he was the lead speaker. His take on the election reminded me of Alfred E. Neuman of Mad Magazine – What me worry? We basically have full employment, less debt and higher wages. What’s not to like? The stock markets had recovered and then some by this date and are expected to remain stable at least in the near term. Interest rates will rise in a long-predicted, stable manner. Real estate markets will continue in the same trajectory. Millennials will postpone buying a home or can’t afford one. Unemployment in this segment is much higher than with the 35+ year old segment. Buying a home is just not as popular an option for this group as in prior generations and they’re OK with that. Coastal markets will remain unaffordable with a dwindling middle class and the social dislocation that comes with that.

However, the one thing we can count on over long periods of time is that markets fluctuate. They do not ascend in an upwards pattern forever. This is one of the longest expansions we have had. We are due or perhaps overdue for a change, so don’t be surprised when it comes. Be prepared.

Brian Johnson is a bright, young man who has some impressive brokerage production under his belt. He is now the general manager of Radius Group, one of the larger commercial real estate companies locally. Brian gave a snapshot of all local commercial markets. The local commercial and industrial markets have exhibited stable to shrinking vacancy rates and surprise! The Funk Zone is the hot retail market. There is lots of activity in the multifamily market with the number of sales volume set to surpass the 1999-2000 mark. I track this market niche and can tell you that the cap. rates are at the lowest point since 1993. That doesn’t seem to affect volume though. Almost 1/3 of these sales have been off-market. There is substantial demand.

Keith Berry – What can I say? I’ve known Keith from the beginning of my career in 1979. He was one of my mangers. I have a great deal of respect for Keith. He is a gentleman and thoroughly knowledgeable in the local residential market, especially the upper-end. Segments of this market have shown fewer sales than in 2015. Escalating prices and fewer sales make for a few very shallow market segments. Most of the lower-end and mid-range market is not much changed in volume.

Justin Anderson – I don’t personally know Justin Anderson very well although I have met with members of his firm several times in various real estate related financial planning meetings. Justin was cautious which I thought was good advice. He felt that certain sectors of the market have some opportunities for safety and perhaps some growth. He named dividend producing stocks and seemed excited about some plays in the health-care market that has been particularly hit hard of late. He advised defensive plays in today’s market. In his opinion, the market has just been good for far too long.

__________________________________

Brian Bailey is the broker-owner of Central Coast Investments. He is one of the leading multifamily brokers on the Central Coast covering Santa Barbara, Ventura and San Luis Obispo counties. He has a four decade history of success.

Save

Save


South Coast Multifamily Sales Trends – 1993 to 2015

1993-2015 - All GRM, CR 10 Yr Bond
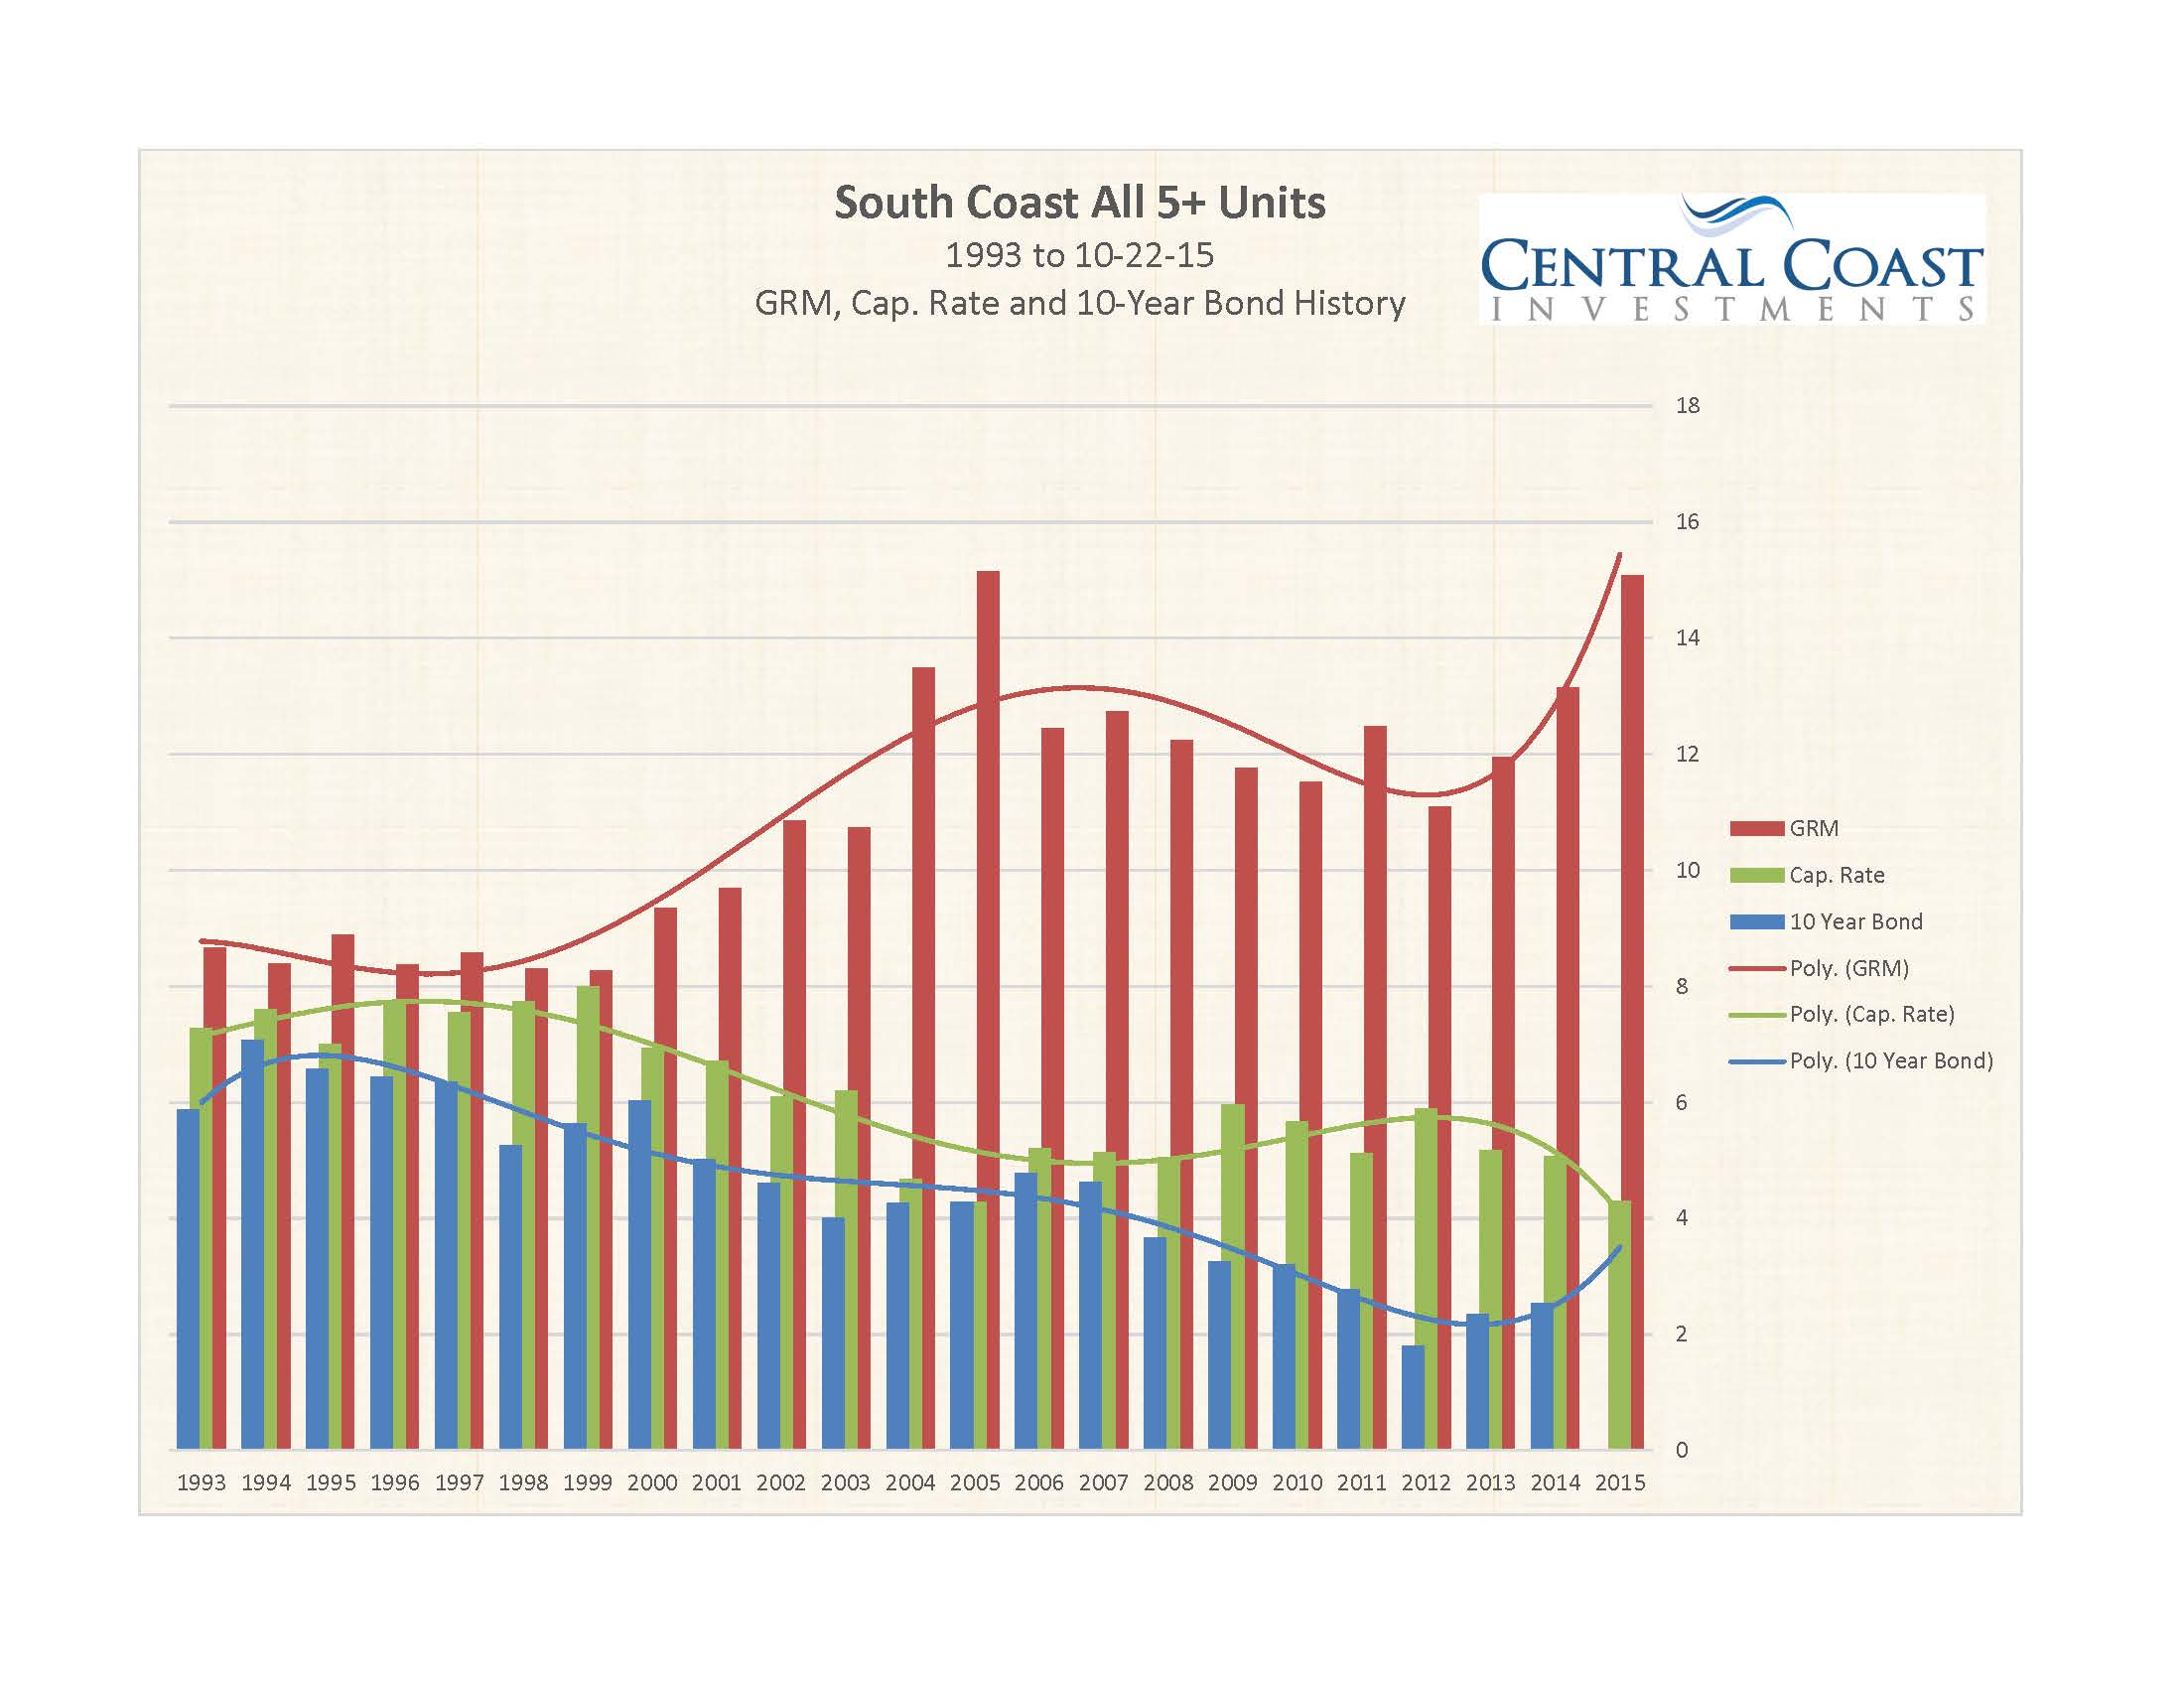
Click chart to enlarge.

I’ve kept tabs on all of the 5+ unit sales on the Santa Barbara County South Coast since 1993. This comes in handy for listing presentations and in gauging the direction of the market. When the data is laid out visually in a graph it’s easier to understand market direction. Trust the data over advice that you should just pay over full price because someone else might buy the property.

Yes, there are pockets of perfection in Santa Barbara where the rules of gravity almost cease to exist: much of East and West Beach, parts of the Mesa, parts of the Riviera and a small group of core areas downtown. If you can afford a trophy property with nonsense numbers good for you. If you need to buy a property that is not in this etheric zone pay attention to the sales data. Also, don’t apply a broad stroke observation to every property equally. There is a world of numerical difference between a small building in a great location and a very large building in a mediocre location.

I just updated my study through Oct. 22, 2015. It’s been a banner year with lots of sales. It’s good to keep history in mind when making decisions in the present. However, opportunity exists in any market. So, what is going on in this market? The GRM / Cap. Rate[1] charts show a market turning solidly towards a sellers’ market since 2013. In fact, the trajectory during 2015 appears to have gone off the charts with excessive buyer behavior.

However, this seeming over-exuberance may be better understood in light of the dramatic rent escalation that has occurred during the past two years. According to the Dyer-Sheehan Group South Coast Apartment Market Survey report rents have increased 5.3% through Oct. 2014[2] with a similar trajectory for 2015. Maybe you can accept a 4% cap. rate if rents will increase 10% in the next 24 months.

The trendlines indicate a market that is very similar to the market in 2004-2005. This market was followed by a rather bleak period that lasted for years. However, it’s likely that continuing substantial rent increases will offset a portion of the current excesses. It seems that all sins of over-exuberance are forgiven locally if you own a property for more than 10 years.

Sets of graphs for each sub-set of multifamily properties: 5-9 units, 10-24 units, 25+ units and the entire set are available to clients.

__________________________________________________________________________

[1] GRM (gross rent multiplier): Value or price / annual gross operating income (GOI) = GRM. This is another factor in measuring or determining the value of a property.

Capitalization rate (cap. rate): The return of the property expressed as a percentage without relation to debt – net operating income (NOI) / price or value = cap. rate. This is one factor in measuring or determining the value of a property.

[2] Oct. 2014 Santa Barbara County – South Coast Apartment Market Survey, Dyer Sheehan Group, Inc.


Economic Summit – April 2015

future-crystal-ball

South Santa Barbara County Economic Summit
Economic Forecast Project, UCSB – April 2015

I attended this program on April 30, 2015. Note that they called it an “economic summit” and not the more typical “economic forecast”. There was not a lot of forecasting done. But that’s OK; predicting future macro-economic events is a bit like predicting the weather a year from now.

I enjoyed this program as usual. It is a nice break from similar local events more geared towards marketing and provided a more neutral viewpoint of macro and micro trends for the Santa Barbara area with bits of wider information on California, the U.S. and the world. UCSB is a world-class university and this event measured up to its high standards.

On the local real estate front – now here’s a surprise: high demand, low supply, rising prices, problematic affordability both on the purchase and rental fronts. Of course, we’ve been hearing this in an endless loop forever, so it’s not likely to change.

Mark Flannery, Chief Economist and Director, Division of Economic and Risk Analysis at the U.S. Securities and Exchange Commission gave a talk about the different levels of risk allowed between “registered” investors and everyone else. This was interesting as I had not realized the entirely different level of risk that is OK with those that oversee these things for people of high net worth and income. It is very expensive to comply with all of the auditing and disclosure requirements in the sale of securities to your man on the street, but your 1% investors get to fly by the seat of their pants. I don’t know if this is a good thing.

By far the most interesting segment of the program was the segment on “Business in The Social Media Age” with Matt Kautz, Director of Social Media and Analytics, Walt Disney Studios and Lisa Jenkins, VP of Marketing & Client Services, The Marketing Distillery. This segment was moderated by Megan McArdle, Columnist, Bloomberg View. Megan did a great job of moderating this cutting edge segment and injecting great humor into the discussion.

If you are not involved in social media in your business you should be. The different social media agents were broken down as to how they might assist the entrepreneur in targeting core groups. Facebook remains the most important and versatile form of social media. Google analytics provides some very interesting data engines to comb all social media for mention of your company, name or interests and email you when a hit is found. Social media is essential in creating brand identity. Expect to spend two to three hours a week on posting and blogging in order to be effective. Define what you want to accomplish and who you are targeting. I guess that this is my weekly contribution right now!

Another extremely interesting segment was a presentation on the AlloSphere Research Facility at the NanoSystems Institute at UCSB. This endeavor is an effort to present visual data analysis in a three and four dimensional venue. Is your head hurting yet? Mine was.

This facility is a sphere located in the California NanoSystems Institute building (Elings Hall) at UCSB. The presentation example involved an examination of the decoupling of the Swiss Franc from the Euro that occurred on January 15, 2015. This move caused a 23% rally in the Swiss Franc almost overnight. The AlloSphere example was a minute by minute examination of this event from several axes. If your head isn’t hurting by now, check your pulse!

Wow! I actually can imagine some applications in engineering and physics, but I am having a bit of trouble understanding how this would be an improvement in economic analysis which would typically be various charts and spreadsheets. As an English literature major maybe I’m not supposed to. But I don’t care. This was a truly amazing presentation. I had no idea of the existence of this facility 10 minutes from my home. I wonder what other wonders lurk on campus?

So, how are we locally and in California? We are doing quite well locally except for the ever-present bugaboos of affordability and the ever-decreasing middle class. Employment has continued to click up quite nicely in comparison, but most job creation is for low-paying positions. Something that will warm some local hearts is that local government employment, the not-surprising largest local employer, actually decreased a few percent from the prior year.

We are doing far better than much of the world though. With Europe, Russia, China and Japan in the economic doldrums our historically modest economic accomplishments look quite good. Look forward to more disturbing news about the economies of Greece, Italy and Portugal.

So, guess what? We are in one of the most sought-after parts of the United States which is doing quite well thank you in relation to most of the world! That’s got to be good news. And no one else has an AlloSphere to boot! I went away quite happy! Now to work on my blogs…


CAR Chief Economist Leslie Appleton Young’s 2014 Review and 2015 Forecast

Click here for CAR Chief Economist Leslie Appleton Young’s review and forecast for the U.S., California and Santa Barbara area’s economy for 2014  and 2015. Consumer confidence is at a seven-year high, but inventory and affordability remain issues.


SBRPA Presentation 05-14-14

I had the pleasure of speaking at the Santa Barbara Rental Property Association (SBRPA) recently about the Santa Barbara South Coast multifamily and commercial markets. I spoke along with my friends and fellow brokers Steve Golis and Brad Frohling of Radius Commercial Group. To view the presentation click here:  SBRPA Presentation 05-14-14.

Technical notes: In the slides on the 20-year history of multifamily sales the GRM and cap. rate factors are based on proforma rents and the trendlines used are five event polynomial.